Subsection 7.2.5 Rankine Cycle
The diagram shown in Figure 7.2.3 is an idealized representation of the Rankine Cycle used in the study of thermodynamics, and known as a temperature-entropy diagram. The heavy dome shaped curve is known as the vapor dome and points under the curve are saturated steam, while points to the left of the curve are liquid water and points to the right of the curve are superheated steam.
Feedwater enters the boiler at point \(1\text{,}\) and is heated by the fuel. Initially, the water temperature rises, until it reaches the saturation temperature for the boiler pressure, point \(1_f\text{,}\) where the water begins to boil. Additional heat added at this point does not raise the temperature any further until all the liquid water is completely vaporized, point \(1_g\text{.}\) The heat added between \(1_f\) and \(1_g\) is the Latent Heat of Vaporization. After the steam has reached point \(1_g\text{,}\) any additional heat added causes the temperature to rise again, and the steam becomes superheated.
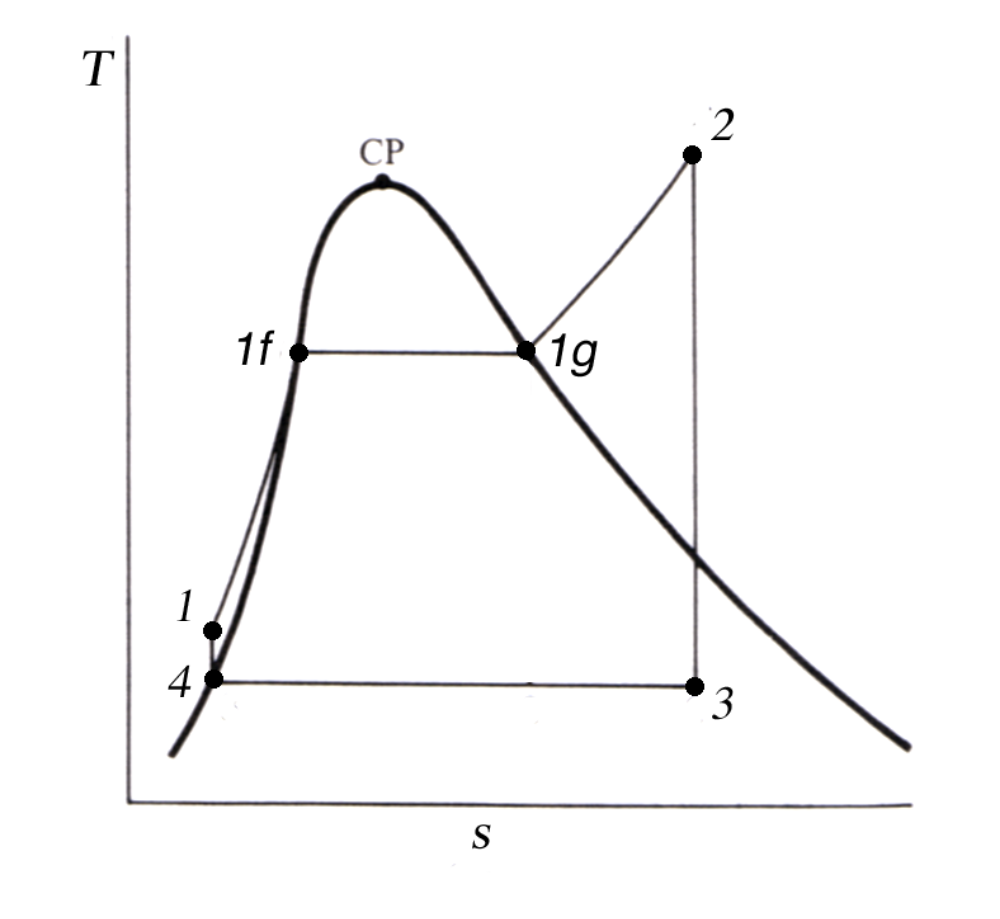
Superheated steam leaves the boiler at point \(2\) and enters the turbine. During the expansion process, the steam pressure and temperature both drop as energy is extracted from the steam. Steam leaves the turbine and enters the condenser at point \(3\text{,}\) which is saturated or wet steam.
In the condenser, heat is removed from the steam and it returns to the liquid state at point \(4\text{.}\) The feed pump raises the water pressure back up to the boiler pressure and the cycle begins again at point \(1\text{.}\) The feed pump causes a small temperature rise in the feedwater as well as a pressure increase.
The area under the curve from \(1\) to \(2\) represents the heat energy added in the boiler and the area under the curve from \(3\) to \(4\) represents the heat rejected to the ocean. The area inside the curve represents the net work done by the cycle.
